You can access the Dashboards and Reports that we have created and published to this website from the link at the bottom of this page.
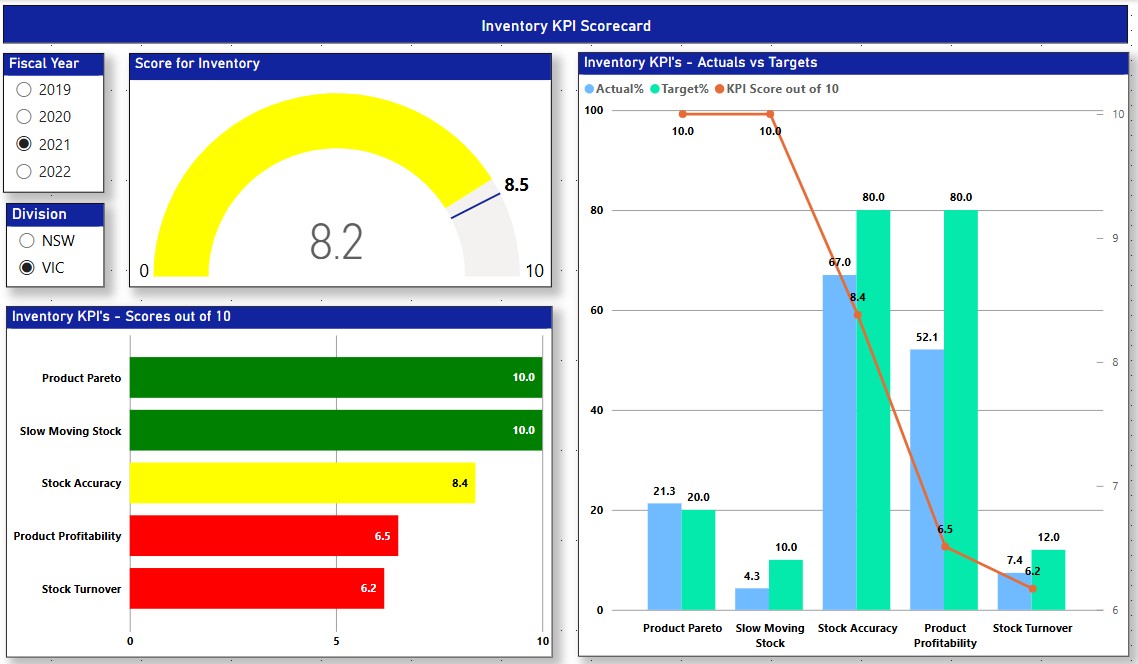
An example is shown below. It contains the KPI Scorecard for the Inventory Management function. The Score for Inventory is shown in the Gauge visual as 8.2, and it is shown in Yellow because it has not reached the target of 8.5 out of 10. The Score for each Inventory KPI is shown in the Bar Chart, and the Actuals versus Targets for each KPI are shown in the Column Chart, with the KPI Score for each shown on the Orange Line. The Inventory Manager can quickly see that the most pressing issues to resolve are Product Profitability and Stock Turnover.
Discover Perennial BI for Inventory Management
Perennial BI provides the visual insights that help Inventory Managers identify the company's most profitable and
sought-after products, and deliver them to its customers in full and on time. You can have a look at the Dashboards
and Reports that we have created with sample data for the Inventory Management function by
clicking here
You can scroll through each page one by one from the Page Number navigator at bottom right of each page. And of course, if you have any questions, or would like a guided tour, please refer to the Contact Us page to give us a call or send us an email so we can schedule a no obligation online meeting.